Cargamos los datos
import os

path = 'data/eurosat'

splits = os.listdir(path)
splits
['test', 'train']
train_path = os.path.join(path, 'train')
test_path = os.path.join(path, 'test')
classes = os.listdir(train_path)
classes
['River',
 'Residential',
 'HerbaceousVegetation',
 'PermanentCrop',
 'Forest',
 'SeaLake',
 'Industrial',
 'Highway',
 'Pasture',
 'AnnualCrop']
import pandas as pd

train_images, labels, labels_ixs = [], [], []
for c in classes:
    for img in os.listdir(os.path.join(train_path, c)):
        train_images.append(os.path.join(train_path, c, img))
        labels_ixs.append(classes.index(c))
        labels.append(c)

df = pd.DataFrame({'image': train_images, 'label': labels, 'label_ix': labels_ixs})
df
| image | label | label_ix | |
|---|---|---|---|
| 0 | data/eurosat/train/River/River_392.jpg | River | 0 |
| 1 | data/eurosat/train/River/River_1102.jpg | River | 0 |
| 2 | data/eurosat/train/River/River_1813.jpg | River | 0 |
| 3 | data/eurosat/train/River/River_2471.jpg | River | 0 |
| 4 | data/eurosat/train/River/River_1406.jpg | River | 0 |
| ... | ... | ... | ... |
| 21595 | data/eurosat/train/AnnualCrop/AnnualCrop_1957.jpg | AnnualCrop | 9 |
| 21596 | data/eurosat/train/AnnualCrop/AnnualCrop_598.jpg | AnnualCrop | 9 |
| 21597 | data/eurosat/train/AnnualCrop/AnnualCrop_1670.jpg | AnnualCrop | 9 |
| 21598 | data/eurosat/train/AnnualCrop/AnnualCrop_2839.jpg | AnnualCrop | 9 |
| 21599 | data/eurosat/train/AnnualCrop/AnnualCrop_928.jpg | AnnualCrop | 9 |
21600 rows × 3 columns
test_images = os.listdir(test_path)
len(test_images)
5400
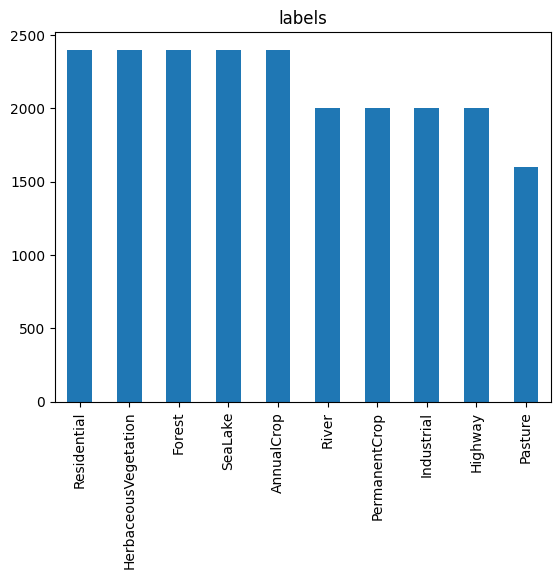
import matplotlib.pyplot as plt

plt.figure()
ax = plt.subplot(1, 1, 1)
df['label'].value_counts().plot(kind='bar', ax=ax)
ax.set_title('labels')
plt.show()
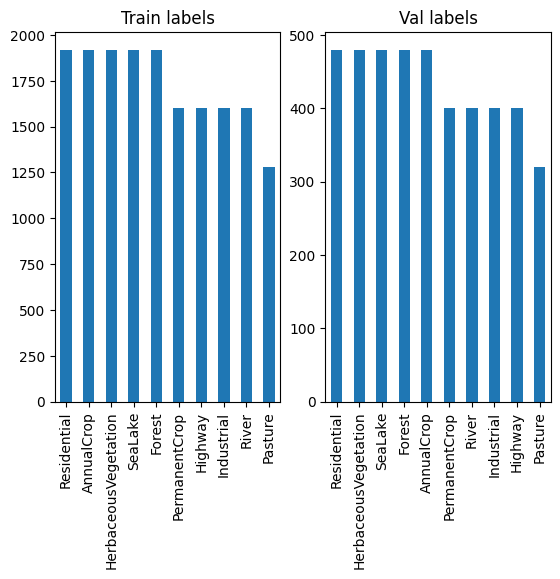
Creamos train y valid splits
from sklearn.model_selection import train_test_split

train_df, val_df = train_test_split(df, test_size=0.2, stratify=df['label'], random_state=42)

train_df.shape, val_df.shape
((17280, 3), (4320, 3))
plt.figure()
ax = plt.subplot(1, 2, 1)
train_df['label'].value_counts().plot(kind='bar', ax=ax)
ax.set_title('Train labels')
ax = plt.subplot(1, 2, 2)
val_df['label'].value_counts().plot(kind='bar', ax=ax)
ax.set_title('Val labels')
plt.show()
import torch
from skimage import io
import numpy as np

class Dataset(torch.utils.data.Dataset):
    def __init__(self, images, labels):
        self.images = images
        self.labels = labels
    def __len__(self):
        return len(self.images)
    def __getitem__(self, index):
        image = io.imread(self.images[index])
        label = self.labels[index]
        return torch.from_numpy(image.astype(np.float32) / 255.), label

ds = {
    'train': Dataset(train_df['image'].values, train_df['label_ix'].values),
    'val': Dataset(val_df['image'].values, val_df['label_ix'].values)
}

dl = {
    'train': torch.utils.data.DataLoader(ds['train'], batch_size=16, shuffle=True),
    'val': torch.utils.data.DataLoader(ds['val'], batch_size=16, shuffle=False)
}
batch = next(iter(dl['train']))
images, labels = batch

images.shape, labels.shape
(torch.Size([16, 64, 64, 3]), torch.Size([16]))
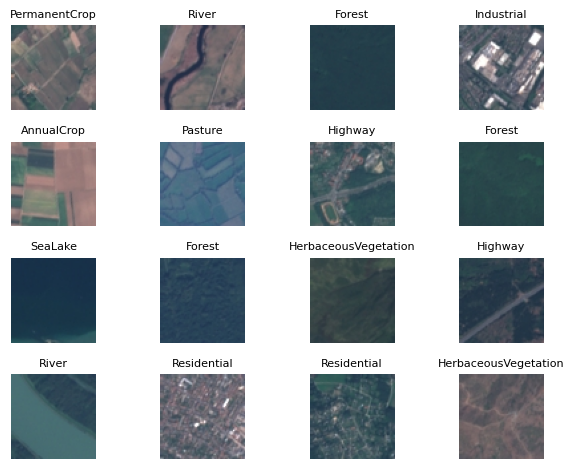
fig = plt.figure()
rows, cols = 4, 4
for i in range(rows * cols):
    ax = plt.subplot(rows, cols, i + 1)
    ax.imshow(images[i])
    ax.set_title(classes[labels[i]], fontsize=8)
    ax.axis('off')
plt.tight_layout()
plt.show()
import timm
import lightning as L
from einops import rearrange

class Module(L.LightningModule):
    def __init__(self):
        super().__init__()
        self.model = timm.create_model('resnet18', pretrained=True, num_classes=len(classes))
        self.loss_fn = torch.nn.CrossEntropyLoss()
        self.metric = lambda y_hat, y: torch.sum(torch.argmax(y_hat, dim=1) == y).item() / y.shape[0]

    def configure_optimizers(self):
        return torch.optim.Adam(self.parameters(), lr=1e-3)

    def forward(self, x):
        return self.model(rearrange(x, 'b h w c -> b c h w'))

    def training_step(self, batch, batch_idx):
        x, y = batch
        y_hat = self(x)
        loss = self.loss_fn(y_hat, y)
        self.log('train_loss', loss)
        self.log('train_acc', self.metric(y_hat, y), prog_bar=True)
        return loss

    def validation_step(self, batch, batch_idx):
        x, y = batch
        y_hat = self(x)
        loss = self.loss_fn(y_hat, y)
        self.log('val_loss', loss)
        self.log('val_acc',self.metric(y_hat, y), prog_bar=True)
module = Module()

trainer = L.Trainer(
    accelerator="cuda",
    devices=1,
    max_epochs=5,
)

trainer.fit(module, dl['train'], dl['val'])
Generate submission
from tqdm import tqdm

module.eval()
module.cuda()
with torch.no_grad():
    preds = []
    for img in tqdm(test_images):
        image = io.imread(os.path.join(test_path, img))
        image = torch.from_numpy(image.astype(np.float32) / 255.).unsqueeze(0)
        pred = module(image.cuda())
        preds.append(classes[torch.argmax(pred).item()])

assert len(preds) == len(test_images)
100%|██████████| 5400/5400 [00:12<00:00, 427.65it/s]
test_df = pd.DataFrame({'image': test_images, 'label': preds})
test_df
| image | label | |
|---|---|---|
| 0 | 3804.jpg | SeaLake |
| 1 | 4565.jpg | Industrial |
| 2 | 3778.jpg | SeaLake |
| 3 | 3110.jpg | Pasture |
| 4 | 0139.jpg | Highway |
| ... | ... | ... |
| 5395 | 1079.jpg | SeaLake |
| 5396 | 3296.jpg | HerbaceousVegetation |
| 5397 | 3666.jpg | SeaLake |
| 5398 | 1711.jpg | AnnualCrop |
| 5399 | 4236.jpg | HerbaceousVegetation |
5400 rows × 2 columns
test_df.to_csv('submission.csv', index=False)
submission = pd.read_csv('submission.csv')
submission
| image | label | |
|---|---|---|
| 0 | 3804.jpg | SeaLake |
| 1 | 4565.jpg | Industrial |
| 2 | 3778.jpg | SeaLake |
| 3 | 3110.jpg | Pasture |
| 4 | 0139.jpg | Highway |
| ... | ... | ... |
| 5395 | 1079.jpg | SeaLake |
| 5396 | 3296.jpg | HerbaceousVegetation |
| 5397 | 3666.jpg | SeaLake |
| 5398 | 1711.jpg | AnnualCrop |
| 5399 | 4236.jpg | HerbaceousVegetation |
5400 rows × 2 columns